Where’s the Best Place to Age?
Share
This visualisation was created using:
InsightHealthYour chronological age is fixed but your Biological age can go into reverse.
Biological age is used to explain the shortfall between a population’s average life expectancy and the perceived life expectancy of an individual of the same age.
If you eat the right foods and exercised as per government advice you could add several more years to your life by being healthier than your chronological age. Put simply you may be 40 years old but if you exercise and eat the right food your biological age could be 35!
Biological age can therefore be used as a measure for general health as it takes into account many aspects of your lifestyle such as diet, exercise, and sleep. This level of data is of increasing interest to governments and health service providers as it allows them to target resources to encourage a more healthy lifestyle by area and population group. The data is split into gender and age band.
By analysing the average biological age for males aged between 65 and 69 we can compare the health of different nations in the UK. Our data shows that Scotland is the least healthy country with a biological age of 68, whereas it’s 67.6 in Northern Ireland, 67.5 in Wales with England being the healthiest with 66.8
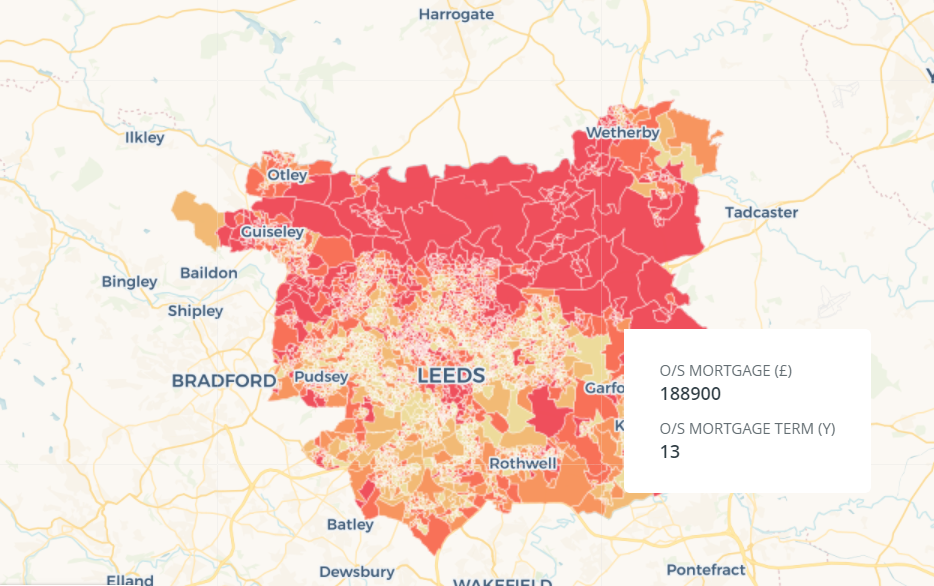
We can further break this down into local authority areas (see visualisation above). On this basis the 5 unhealthiest local authorities based on the biological age of males between 65 and 69 are:
- Glasgow City (70.1)
- Manchester (69.7)
- West Dunbartonshire (69.3)
- Salford (69.2)
- North Lanarkshire (69.2)
Interestingly, these areas are almost all located in the north of England and Scotland, as health is heavily correlated to income it may reflect the disparity in wealth between the north and south of the UK.
With 3 of the top 5 unhealthiest local authorities being located in Glasgow and the surrounding area, it flags this area as being the least healthy in the UK. This would make Glasgow a great target for NHS funding to encourage a healthier lifestyle.
If we look at the 5 healthiest local authorities in the UK they are all found in London and the surrounding area.
- Hart (63.8)
- Waverley (64.0)
- Kensington and Chelsea (64.1)
- Wokingham (64.2)
- Winchester (64.2)
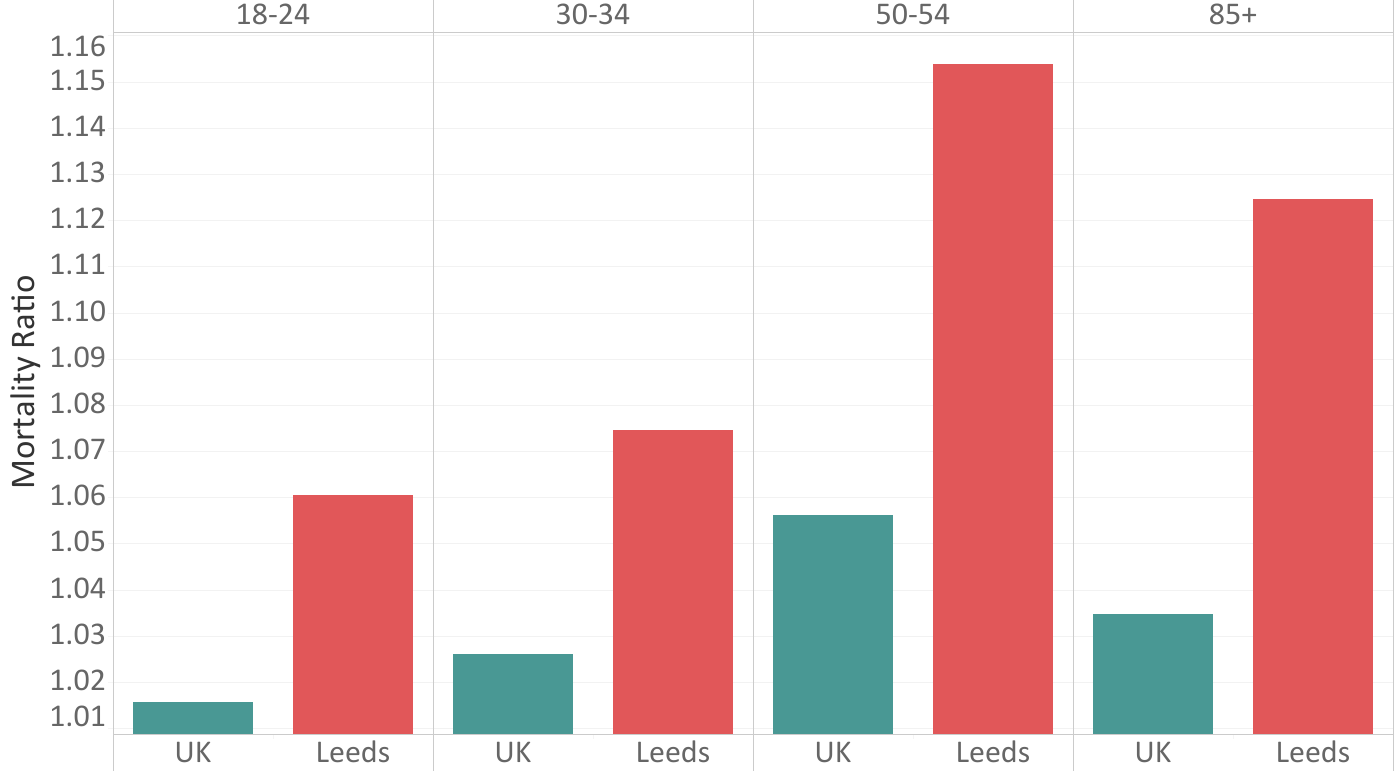
This further highlights the correlation between health and wealth. If we compare the biological age in Glasgow to Hart for all age bands we see the same trend.
Conclusion
The analysis shows that you could have 7 more years of healthy life if you live in Hart compared to Glasgow. Moving from Hart to Glasgow however, won’t improve your health but it does show the disparity between lifestyles across the UK.
Obviously, these numbers should be taken as averages as the outcome will vary from one individual to the next. It should also be noted that the more deprived an area the higher the biological age.
Need to know more about the relative health of a local area?
Our Health package provides modelled insights on COVID-19 Infections, Obesity and Smoking to name a few
Click for more info