Advanced customer profiling
Share
What is expenditure data?
Expenditure data is a model for estimating an areas weekly spend on a wide variety of products, based on their income.
The Office of National Statistics (ONS) creates purchase estimates from the Living Costs and Food Survey of 6,000 households using the classification of individual consumption by purpose (COICOP) categories.
Doorda creates income deciles down to LSOA level from 0-9, with 9 being the wealthiest. Using these deciles to determine an areas expenditure on specific goods and services opens exciting opportunities to enhance your consumer profiling.
Advanced Marketing
Knowledgeable marketers know 2 truths: you can never know too much about your customer and obtaining knowledge is expensive and time-consuming.
Traditional research methods rely heavily on perceptions, opinions and experiences. Problems include; Accuracy of sample representation, time and resource utilisation, dependency on honest responses and not uncovering the full picture.
By contrast, expenditure data provides accurate estimates for spends on extremely specific product classes, with minimal costs and time constraints. It offers insights enabling clients to target their marketing, identify opportunities and increase sales.
Example 1
Let’s imagine we are the owners of ‘Amy’s Winehouse’ off-license in Leeds. If we focus on alcohol and tobacco expenditure, filter by LSOA’s in Leeds and order by expenditure we can see that the highest income decile spends the most on tobacco and alcoholic drinks.
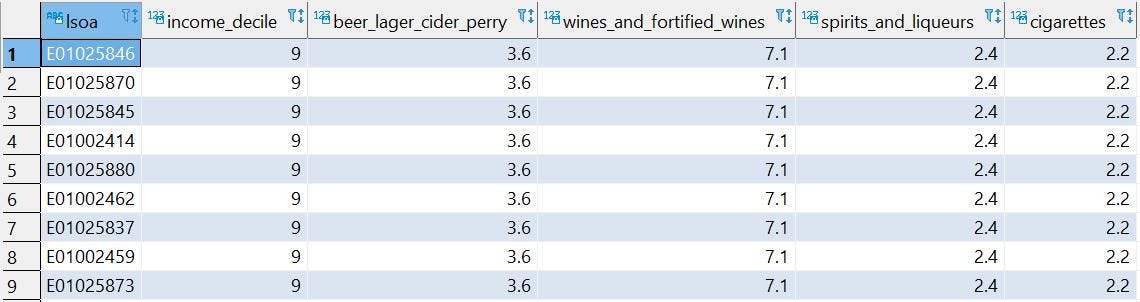
From observing income deciles by LSOA, you can identify which areas are likely to have the highest demand for these products and more importantly the price suitability for the area.
Wine is the most popular alcohol type in the highest decile areas. Amy’s Winehouse can therefore structure its product lines and prices based on its location, as well as targeting promotions within its local area and potentially identify untapped markets. These insights provide a more in-depth understanding of consumers and their behaviour within the area.
We can also link this to Doordas spatial data so it can be visualised on a map…
Example 2
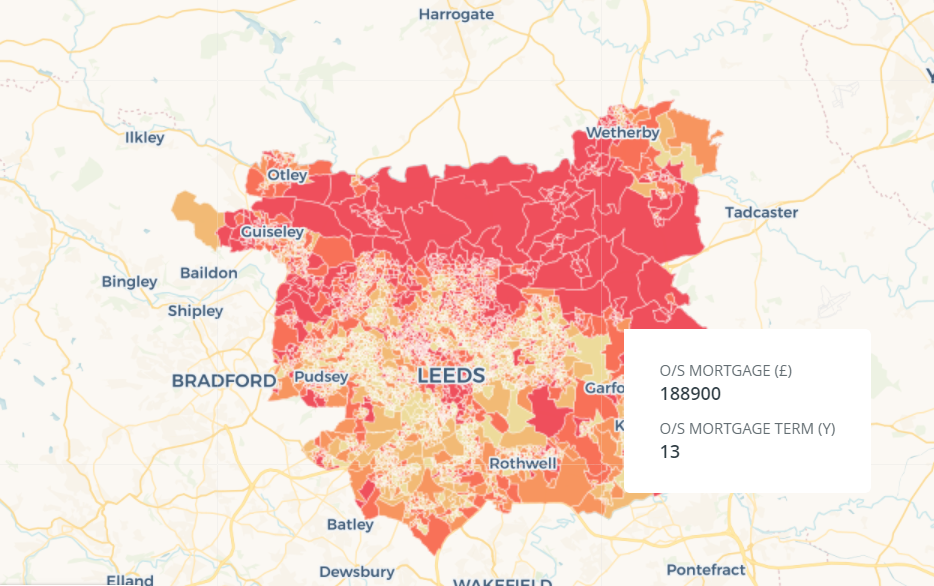
In this example, ‘Big Scary Gym’ is experiencing declines in membership and identified a flawed marketing strategy caused by their lack of understanding of local spending habits. They are also looking to expand their business and want to find the optimum location to open a new centre.
By overlaying Doorda’s expenditure data on a map they get a comprehensive visual representation of consumer behaviour and fitness expenditure (see map above). The business can now target optimum areas with advertising and suitable promotions as well as locating their new centre close to the most promising customers.
Conclusion
Expenditure data provides many key insights including determining price points, identifying untapped markets, consumer behaviour, determining likely product demand locally, helping with targeted promotions and enabling estimates of total expenditure within a local area for different products and services. In summary, it offers a comprehensive understanding of your customer base, with minimal costs and expenditure.
Want even more data on your customers?
We hold data on crime, health, income and so much more, all to extremely granular levels.
Click here for more info