Does Poverty Drive Obesity?
Share
Obesity levels are increasing across all age bands in the UK, however, there are strong correlations with socio-demographic factors.
Before going any further is worth detailing how Adult Obesity is measured, in the UK we use the World Health Organization’s (WHO) body mass index (BMI) this divides weight by height using the following classification:
| Range | Category |
| Less than 18.5kg/m2 | Underweight |
| 18.5 to <25kg/m2 | Healthy weight |
| 25 to <30kg/m2 | Overweight |
| 30 to <40kg/m2 | Obese |
| 40kg/m2 or more | Severely Obese |
Note: BMI is not used to diagnose obesity because people who are very muscular can have a high BMI without much fat.
A more useful measure of excess fat is waist size, which can be used as an additional measure in people who are overweight (with a BMI of 25 to 29.9) or moderately obese (with a BMI of 30 to 34.9).
Generally, men with a waist size of 94cm or more and women with a waist size of 80cm or more are at a higher risk of developing obesity-related health problems.
Obesity greatly increases the risk of suffering from potentially life-threatening conditions, these include:
- type 2 diabetes
- coronary heart disease
- some types of cancer, such as breast cancer and bowel cancer
- stroke
Obesity can also affect a persons quality of life and lead to psychological problems, such as depression and low self-esteem.
It’s a common problem in the UK that’s estimated to affect around 1 in every 4 adults and around 1 in every 5 children aged 10 to 11.
Measuring Poverty
The Indices of Multiple Deprivation (IMD) are a widely used metric to measure poverty in small areas. It is derived from 7 components including income, education, health, and crime. Each small area (LSOA for England and Wales) is given an IMD rank with 1 being the most deprived and 32,844 being the least deprived (in England).
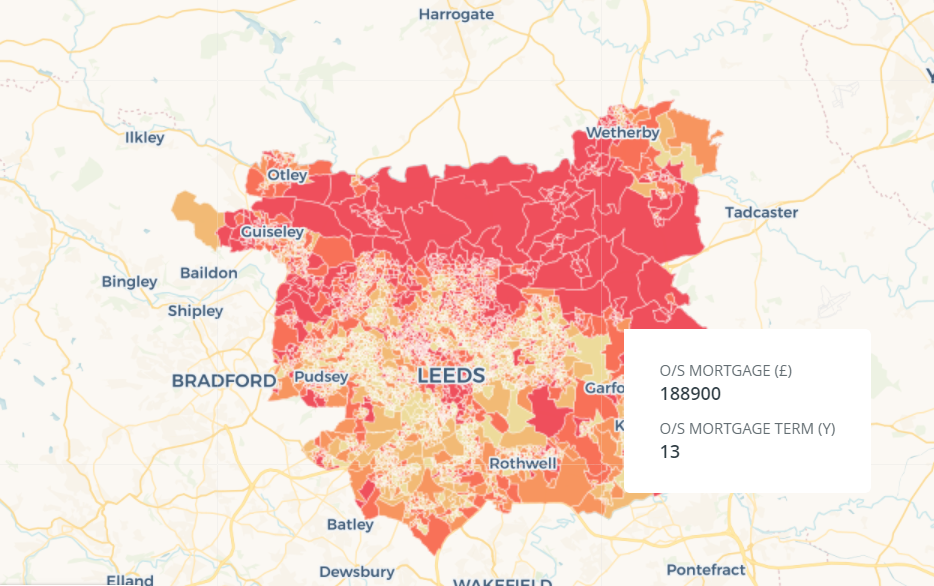
Using Leeds as an example, we can see there is a wide divergence in obesity rates even at a very local level. They can differ by over 40%. The IMD ranks also vary greatly with the least deprived area ranking 32,664 and the most deprived area ranking 38.
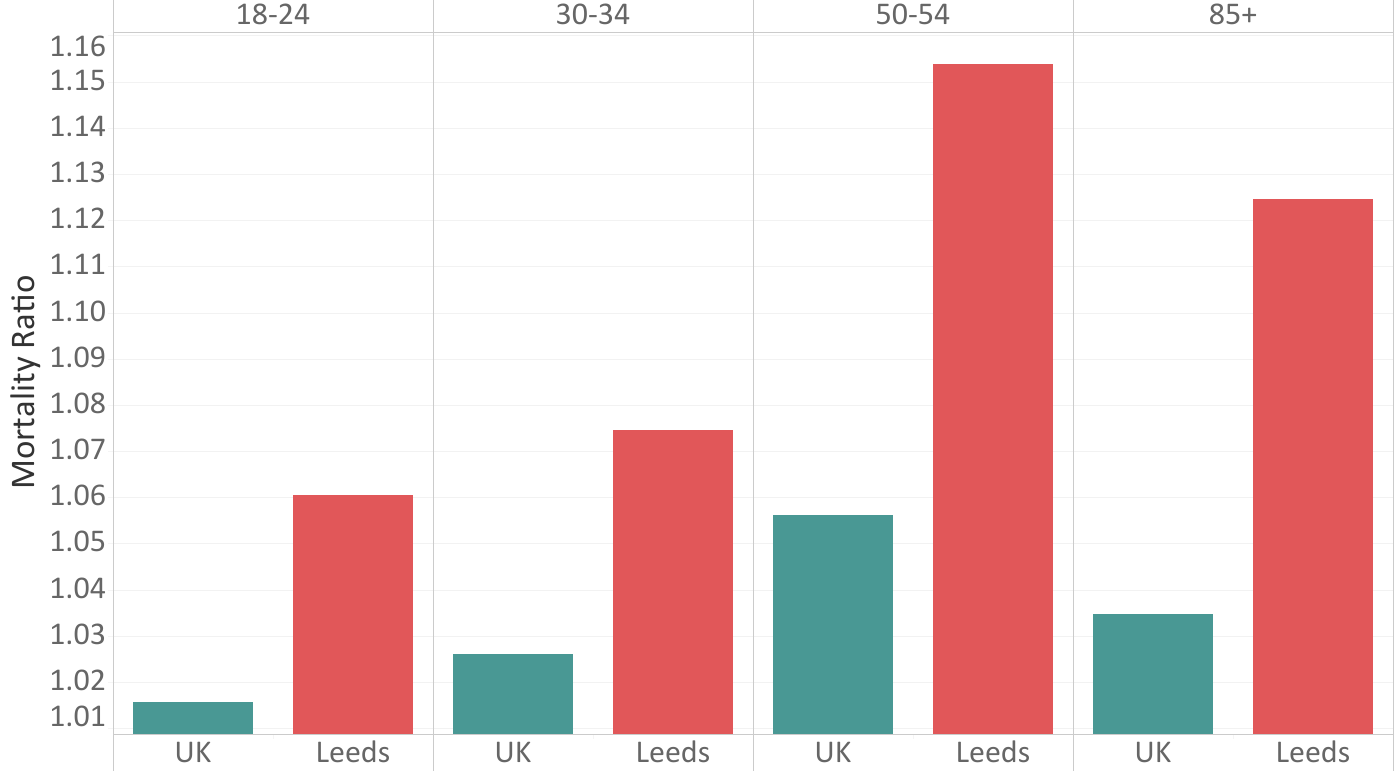
As you can see from the map of Leeds the areas of high obesity show a strong correlation with the most deprived areas. This is best shown by the graph below which compares the obesity rate and IMD rank of the most and least obese areas.
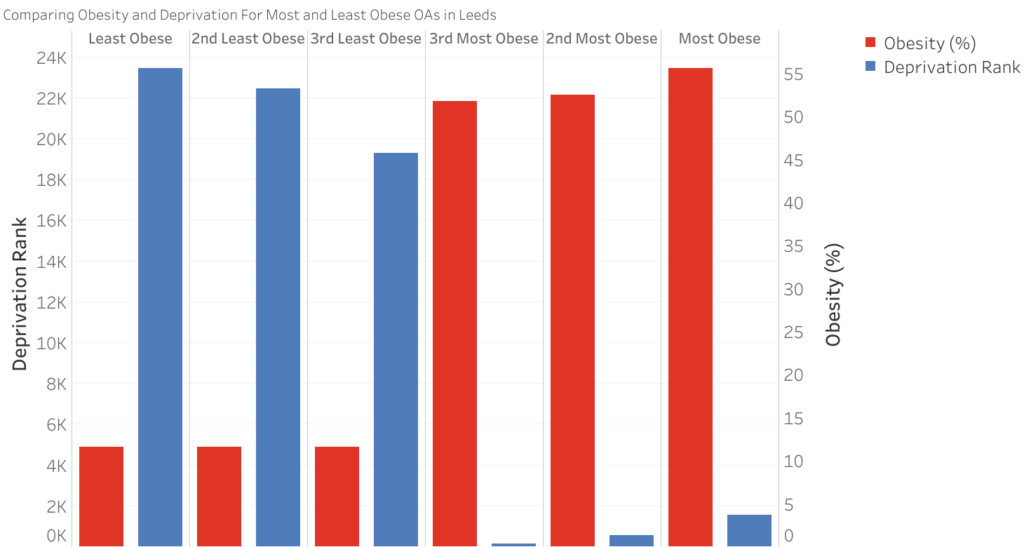
We can see a strong correlation between areas with high obesity rates and a low IMD rank. This is likely caused by the increased stress of living in poverty which leads to poor lifestyle choices, ultimately putting people at greater risk of being obese and developing related diseases.
The same correlation can be seen when we look at household income, a key metric in determining the IMD.
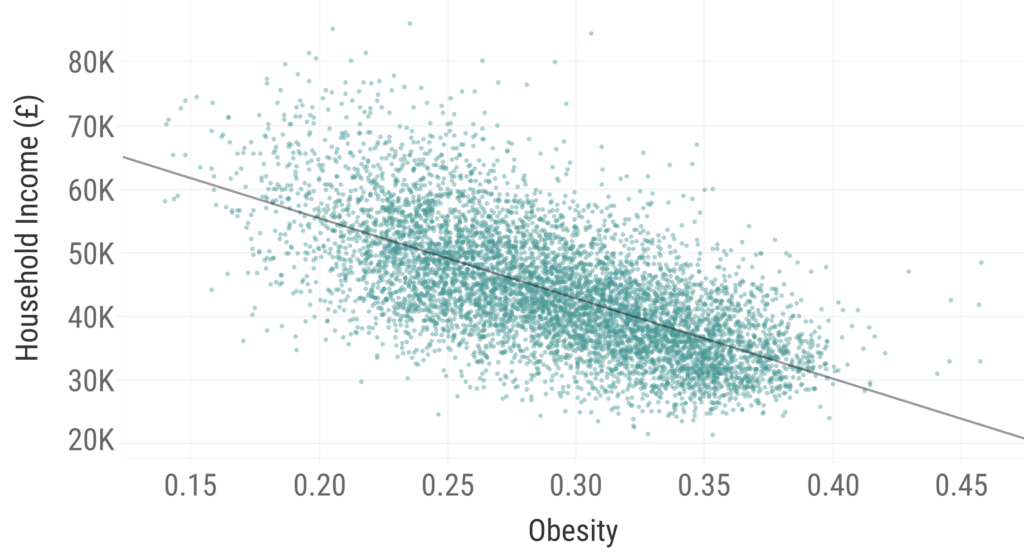
This further clarifies the relationship between poverty and obesity.
Given this relationship, campaigns for increasing healthy eating and exercise may be treating the symptoms but not the disease when it comes to tackling obesity. Focusing on financial aid for the most deprived areas may have a longer-lasting impact on peoples health and save the NHS millions at the same time.
Need to know more about the relative health of a local area?
Our Health package provides modelled insights on COVID-19 Infections, Obesity and Smoking to name a few
Click for more info