

The Hidden Network Behind UK Business: What Company Director Data Reveals
At Doorda, analysing over 45 million director records exposes patterns that go far beyond basic registry searches.
22 MARCH 2026Did you know that one individual holds 45,031 directorships? Or that a single organisation connects to nearly 7,000 directors?
This is the reality uncovered through company director data—a powerful but underused dataset that reveals how influence, governance, and risk are distributed across the UK economy.
At Doorda, analysing over 45 million director records exposes patterns that go far beyond basic registry searches—highlighting hidden networks, risk clusters, and systemic behaviours.
Crucially, this company director dataset (DirectorX) is refreshed daily, delivered as a single unified dataset, and enhanced with proprietary variables unique to Doorda—making it significantly more actionable than fragmented public records.
UK Company Director Data: The Big Picture
Understanding the scale is critical before interpreting the extremes.
Key Metrics from UK Company Director Data
| Metric | Count |
|---|---|
| Unique Companies | 16.3M |
| Total Directorships | 45.2M |
| Unique Directors | 23.7M |
| Active Directors | 17.9M (75.8%) |
| Resigned Directors | 7.4M (24.2%) |
| Unique Addresses | 8.0M |
| Disqualified Directors | 65,101 |
The Most Connected Directors in the UK
Top 10 Directors by Directorships
| Rank | Director Name | Directorships |
|---|---|---|
| 1 | Barbara Kahan | 45,031 |
| 2 | Yomtov Eliezer Jacobs | 32,005 |
| 3 | Peter Anthony Valaitis | 21,155 |
| 4 | Michael Duke | 12,581 |
| 5 | Graham Michael Cowan | 10,062 |
| 6 | Lesley Joyce Graeme | 9,916 |
| 7 | Ashok Bhardwaj | 9,260 |
| 8 | Dorothy May Graeme | 9,092 |
| 9 | Terence Dunne | 8,195 |
| 10 | Stephen George Mabbott | 8,161 |
What This Means
At first glance, these figures appear extreme—but this is where enriched company director data adds essential context.
High-volume directorships may indicate:
- Corporate service providers
- Nominee directors
- Legal structuring roles
- Large-scale company formation activity
When “Busy Directors” Become a Signal
A key nuance in company director data is that holding multiple directorships is not inherently a red flag—but it can become one depending on the context.
Not Always a Problem
Directors with multiple roles can bring experience, networks, and reputational value across companies. Research shows that such directors may enhance performance through shared knowledge and connections (often called the “reputation effect”).
In many cases, high appointment volumes simply reflect:
- Professional or nominee roles
- Corporate group structures
- Legal frameworks such as LLPs or investment vehicles
When It Becomes a Risk Indicator
However, the same data can signal risk when combined with other factors.
Research highlights a competing “busyness hypothesis”—suggesting that too many roles can reduce oversight and effectiveness. (White Rose Research Online)
Key risks include:
- Overextension: Directors may lack time to properly monitor companies
- Conflicts of interest: Overlapping roles across related businesses
- Governance breakdowns: Evidence links busy directors to weaker monitoring and even missed board meetings (ScienceDirect)
The Takeaway
The presence of a “busy director” is not the issue—the pattern behind it is.
In company director data, volume alone means little. But when combined with signals like rapid turnover, shared addresses, or disqualifications, it becomes a powerful early warning indicator.
The Most Connected Companies
Top 10 Companies by Director Connections
| Rank | Company Number | Company Name | Directors |
|---|---|---|---|
| 1 | OC338303 | Ernst & Young Europe LLP | 6,916 |
| 2 | OC417204 | Deloitte NSE LLP | 3,091 |
| 3 | OC312300 | Openwork Partnership LLP | 2,583 |
| 4 | OC303525 | PricewaterhouseCoopers LLP | 2,434 |
| 5 | OC404642 | Hightekers LLP | 2,395 |
| 6 | OC300001 | Ernst & Young LLP | 2,219 |
| 7 | OC372349 | Riverside Professionals LLP | 2,096 |
| 8 | OC305357 | DLA Piper International LLP | 2,003 |
| 9 | 07480551 | FPS 001 Ltd | 1,966 |
| 10 | OC324045 | KPMG Europe LLP | 1,965 |
What the list measures:
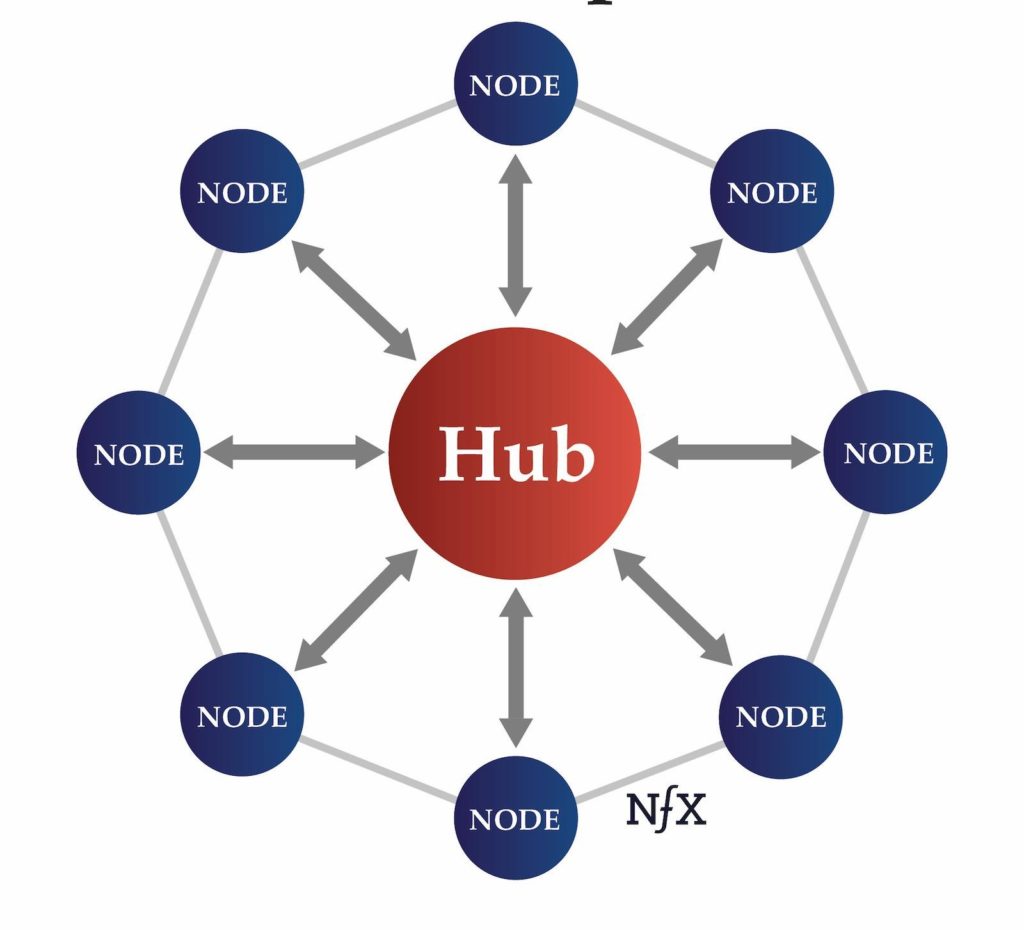
Doorda maps UK companies as a network where firms are connected if they share directors. Companies with many shared directors become highly connected “hubs.” Note that the company prefix OC means it’s registered as a Limited Liability Partnership for England & Wales.
Why certain companies rank highly:
They appear in the Top 10 because they have unusually large numbers of shared directors, often due to how they are structured:
- Large corporate groups: Same directors sit across many subsidiaries, creating dense internal links.
- Service/nominee companies: Reuse directors across numerous entities, boosting connections.
- Financial/legal structures (e.g. SPVs, property firms): Share directors across multiple vehicles designed for ownership and risk management.
High-Risk Directors: Identifying Governance Red Flags
Top 10 Directors by Disqualification Risk
| Rank | Name | Directorships | Disqualifications | Risk Score |
|---|---|---|---|---|
| 1 | Denis Christopher Carter Lunn | 1,733 | 618 | 35.7% |
| 2 | Ian Dunsford | 341 | 321 | 94.1% |
| 3 | Paul James Manley | 312 | 306 | 98.1% |
| 4 | Anthony Martin | 536 | 305 | 56.9% |
| 5 | Julian Richard Beardsley | 389 | 229 | 58.9% |
| 6 | Willem Marthinus De Beer | 213 | 206 | 96.7% |
| 7 | John Drewe Abbotts | 209 | 205 | 98.1% |
| 8 | Richard John Adam | 194 | 191 | 98.5% |
| 9 | Graeme Andrew Ogden | 188 | 186 | 98.9% |
| 10 | Simon John Thorne | 195 | 185 | 94.9% |
What This Reveals
- Risk is highly concentrated, not evenly distributed
- Some directors show systematic governance failure patterns
What the list shows:
It ranks directors based on how closely their track records match patterns linked to potential disqualification under the Company Directors Disqualification Act 1986.
Why certain names appear:
They typically have multiple risk indicators, such as:
- Repeated involvement in failed or dissolved companies
- Possible “phoenix” patterns (restarting similar businesses after failure)
- Holding many short-term directorships
- Links to previously disqualified directors
- Compliance issues (e.g. late filings)
External reference: https://www.gov.uk/company-director-disqualification
Why Doorda’s Company Director Data Is Different
Most public datasets are:
- Fragmented
- Static
- Difficult to analyse at scale
Doorda changes this by providing:
Daily Refreshed Data
- Ensures decisions are based on current director activity
- Captures new appointments, resignations, and disqualifications in near real-time
Single Unified Company Director Dataset
- No need to merge multiple sources
- Clean, structured, analysis-ready data
Proprietary Variables (Unique to Doorda)
- Risk scoring metrics
- Network connection indicators
- Address clustering signals
- Director behaviour patterns
This allows users to move from data collection → insight → decision far more efficiently.
Need Access to AI-Ready Data?
The companies that thrive on data are those that make smarter decisions, faster. Unlock the intelligence behind one of the UK’s largest business datasets and see how our data, tools, and AI chatbots can turn insight into opportunity for your business.
Book a Demo